Mission Control
Three tabs that answer three different questions: what do I do now, how did the week go, and how is the business doing.
Mission Control is where the day starts. It isn't the board — the board lives in Opportunities. It's three separate readings of the same operation, and each one is for a different moment.
| Tab | What it answers | When you open it |
|---|---|---|
| My day | What do I have to do right now | Every morning |
| Summary | How is the week going, in plain language | Once or twice a week |
| Metrics | What do the hard numbers say | When you want to decide something |
My day — the operational view
Your to-do list for today: reminders you've been sent, opportunities from previous days that are still open, and what you've already ticked off. It's per-person — you see your work, not the team's.
Ticking an item here has a side effect worth knowing: it moves the opportunity to In contact on its own, if you left automatic advance on.
At the top you will find customers who wrote something that needs you (they want to pay, ask something, complain or insist) and got no reply within half an hour. Each one opens the conversation, has a button to write to them on WhatsApp and clears itself as soon as someone answers. Opening WhatsApp does not clear it: it goes away once you reply. If it is urgent and still unanswered after two hours, Trama also messages you on WhatsApp and by email, within your hours and at most five a day. Suppliers, colleagues and personal contacts that share your line are left out.
If you're an owner or admin and left part of the setup for later (your WhatsApp, your team, your catalogue or trying the agent), Finish setting up your agency shows up on the side, with how many tasks are left and an estimate in minutes. Continue takes you back to where you left off. It goes away once all four are done.
To work one stage at a time, the Stage filter keeps only the cards that are Not contacted, Contacted or Quoted, and it combines with Overdue: the quotes that are already due for a follow-up, for instance. The pending list link you get on WhatsApp has the same stages above the list.
Summary — the commercial read
Summary is the week's commercial intelligence — the pulse of your business, written out. Trama reads what happened and tells you in prose: where the bottleneck is, which quotes are running late, whether the problem is generating demand or closing it.
The summary is a snapshot of the period that's updated several times a day, not the live board; the «What this summary is based on» panel shows you where each number comes from. Below it you get the week's headline numbers —how much closed (the amount on won deals, not the flow count), value in play, time to first contact — and a flow diagram showing how the inquiries that came in split across channels and board states.
The first number takes the owner to Close, the calendar-month statement. It is not a fourth Mission Control tab: MC looks at the operational week; Close looks at the month that already ended (sales, net only if every won deal has a cost, and what did not close). A seller sees the number and not the door.
Metrics — the hard dashboard
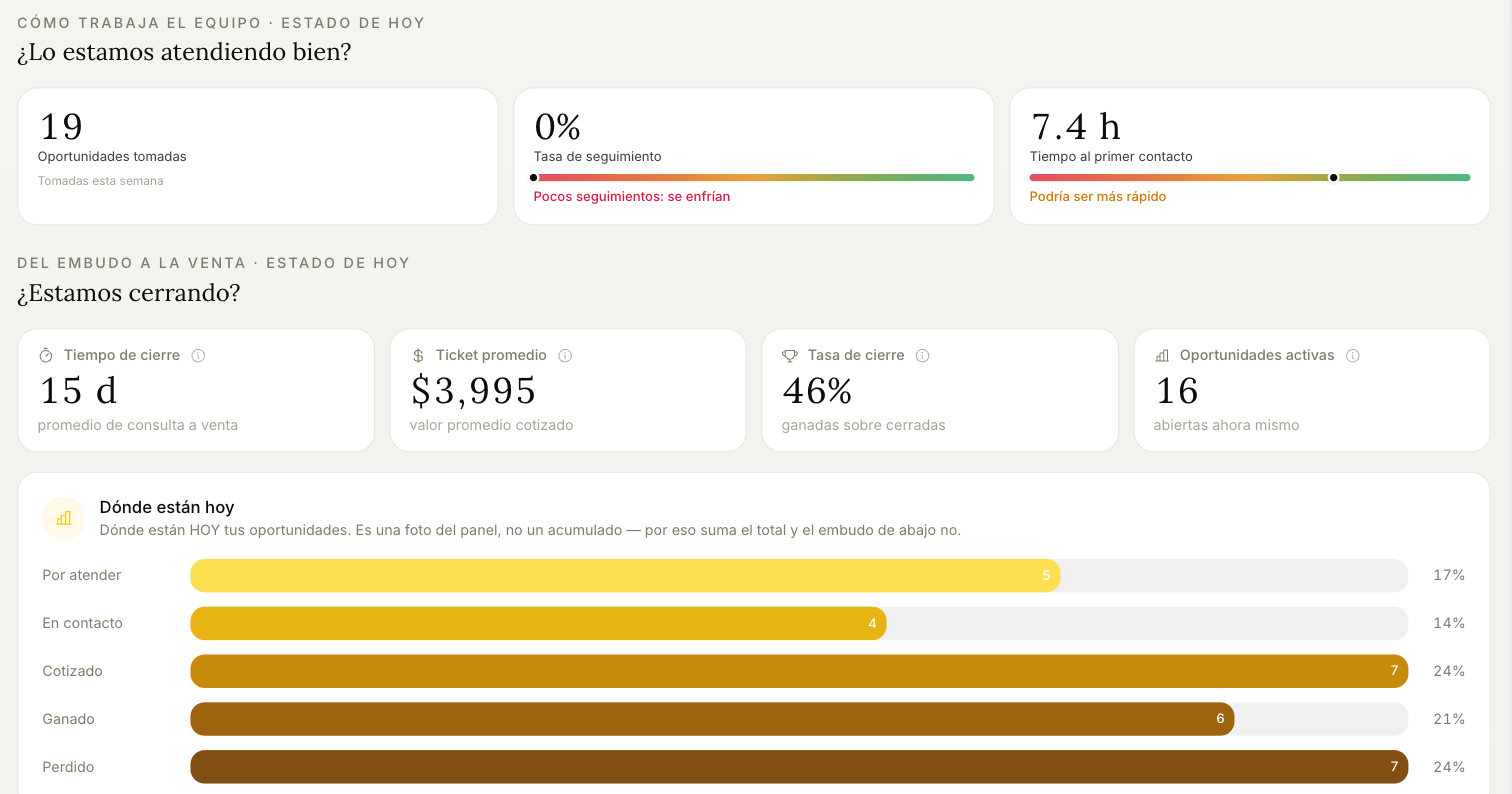
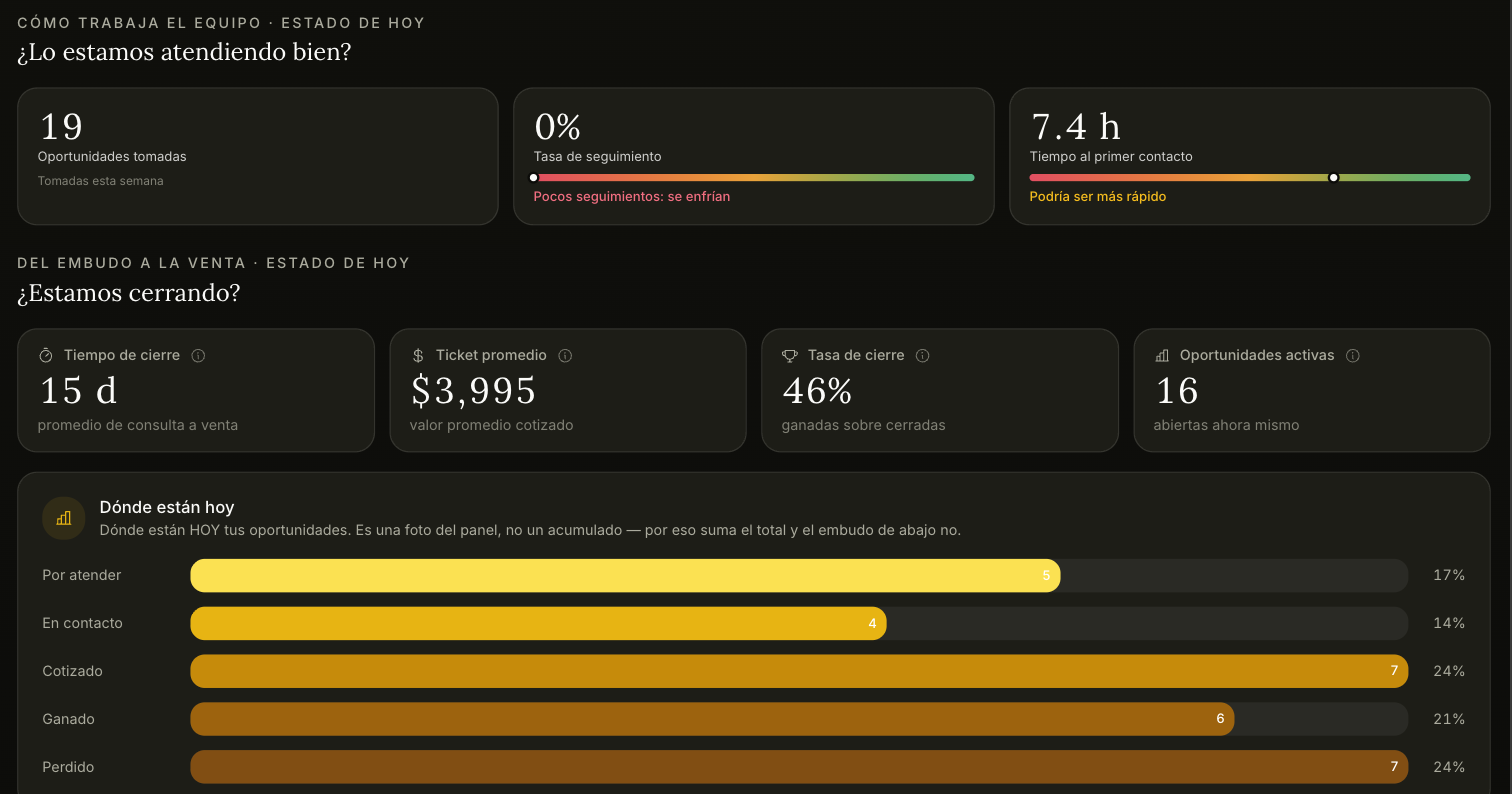
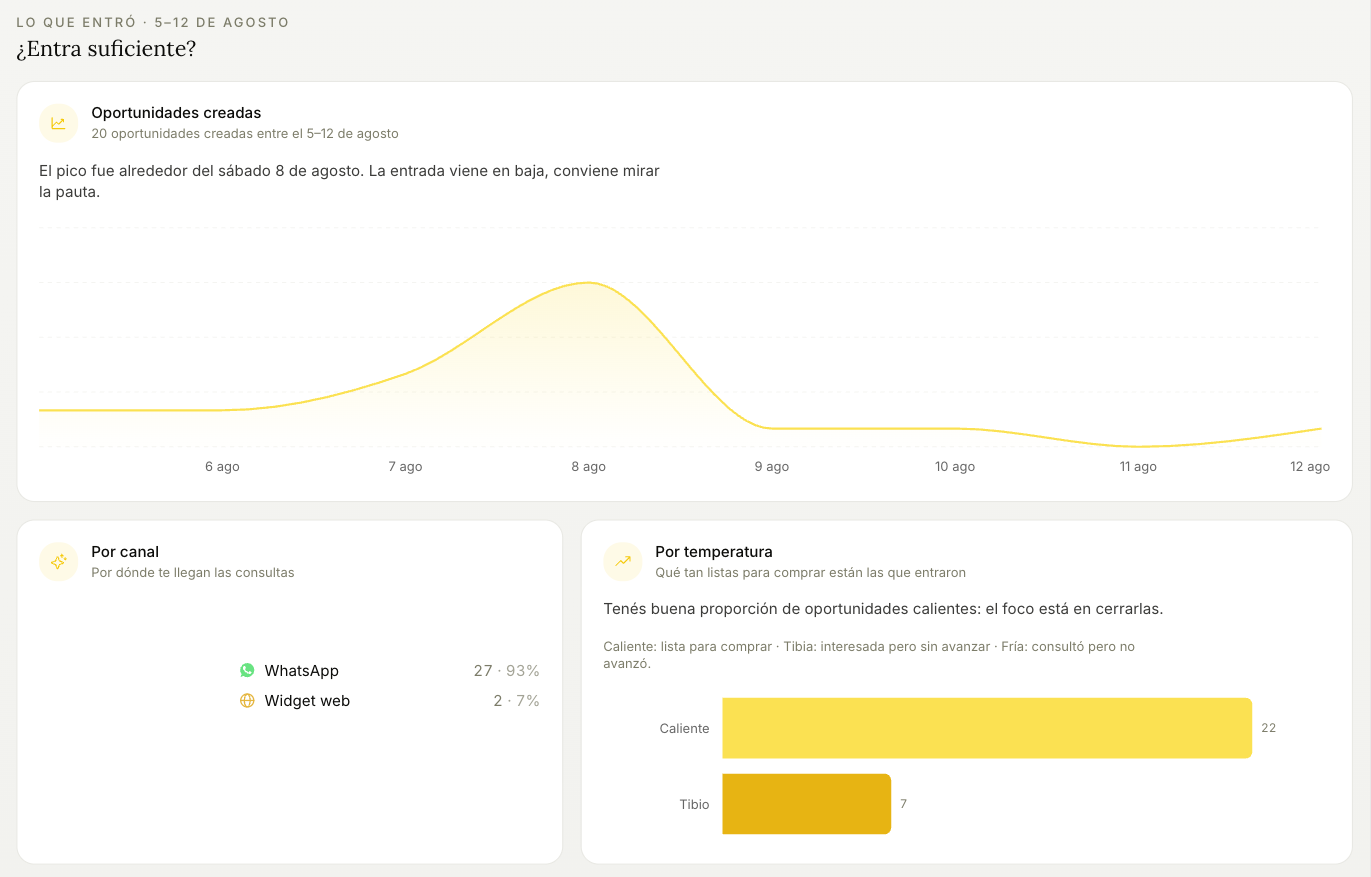
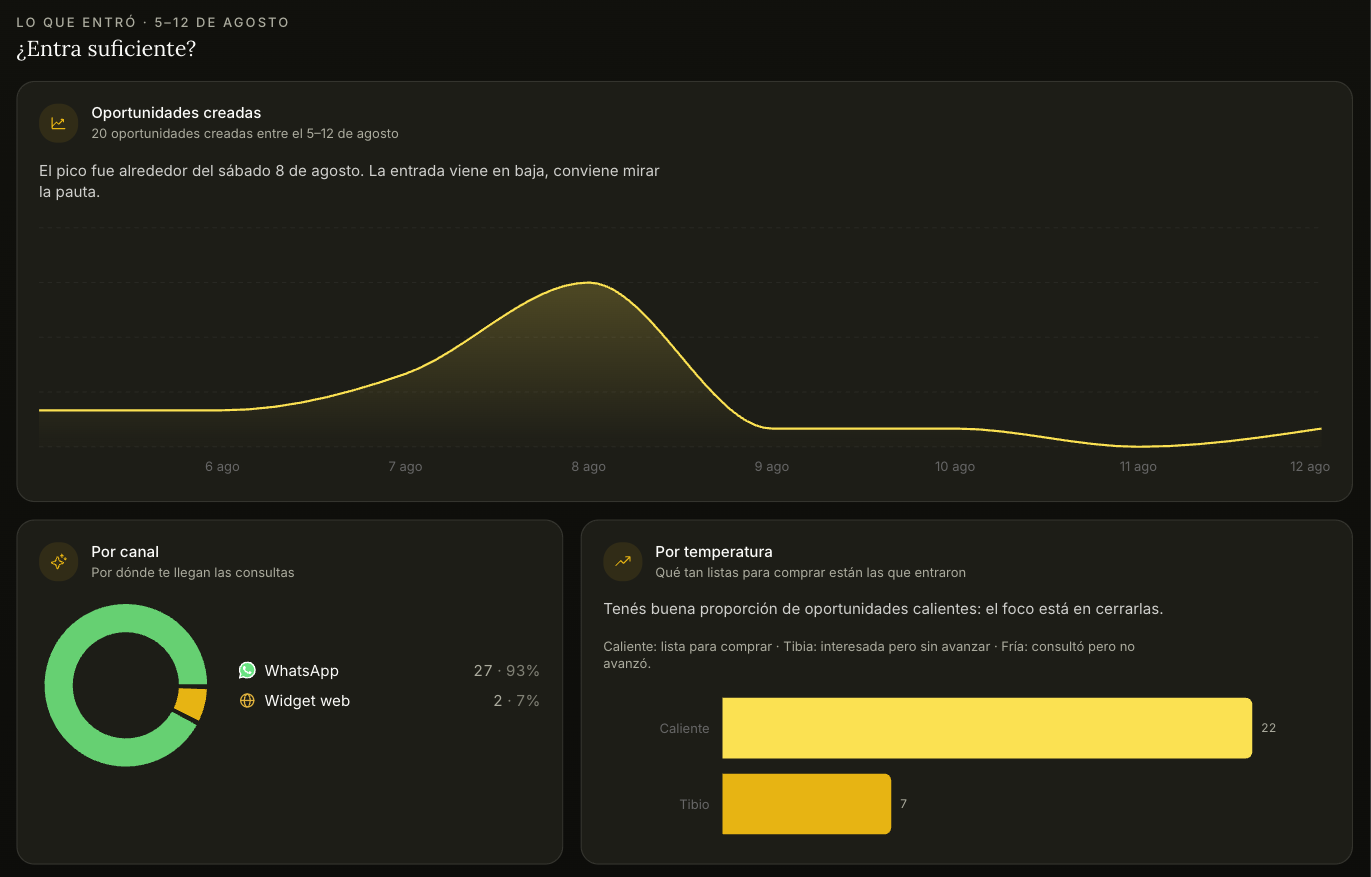
Metrics is a conventional dashboard, but it's organized by question rather than by metric, and each block writes out its own reading — "The peak was around Saturday the 8th. Entry is trending down, worth looking at your ad spend." You don't have to interpret the chart; you have to decide what to do about it.
Four questions, in the order a commercial problem actually gets diagnosed:
- Is enough coming in? — opportunities created over time, by channel, and by temperature.
- Are we handling it well? — opportunities taken, follow-up rate, time to first contact.
- Are we closing? — time to close, average ticket, close rate, and where opportunities are sitting today.
- What is the market asking for? — most requested destinations, party composition, and why deals are lost.
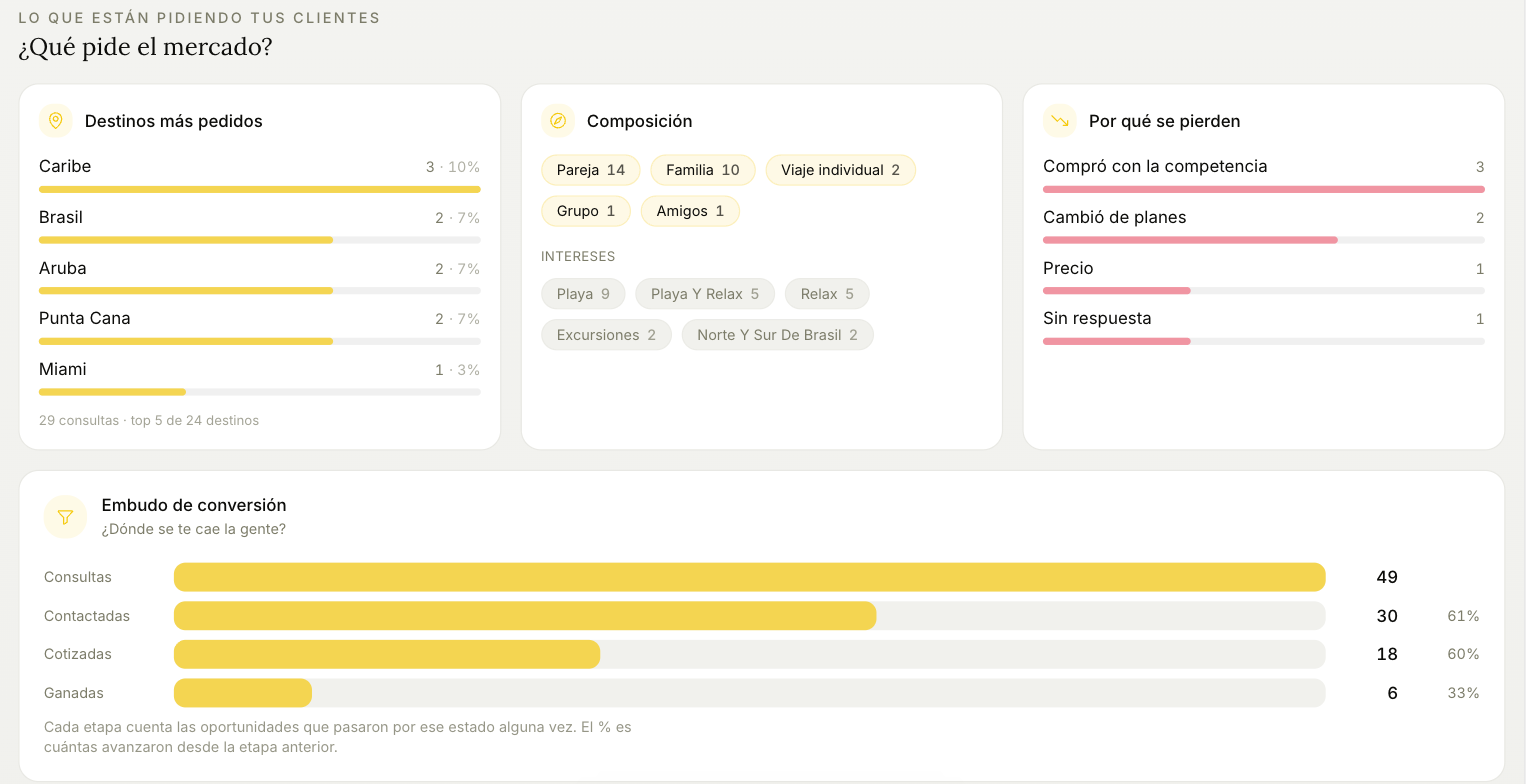
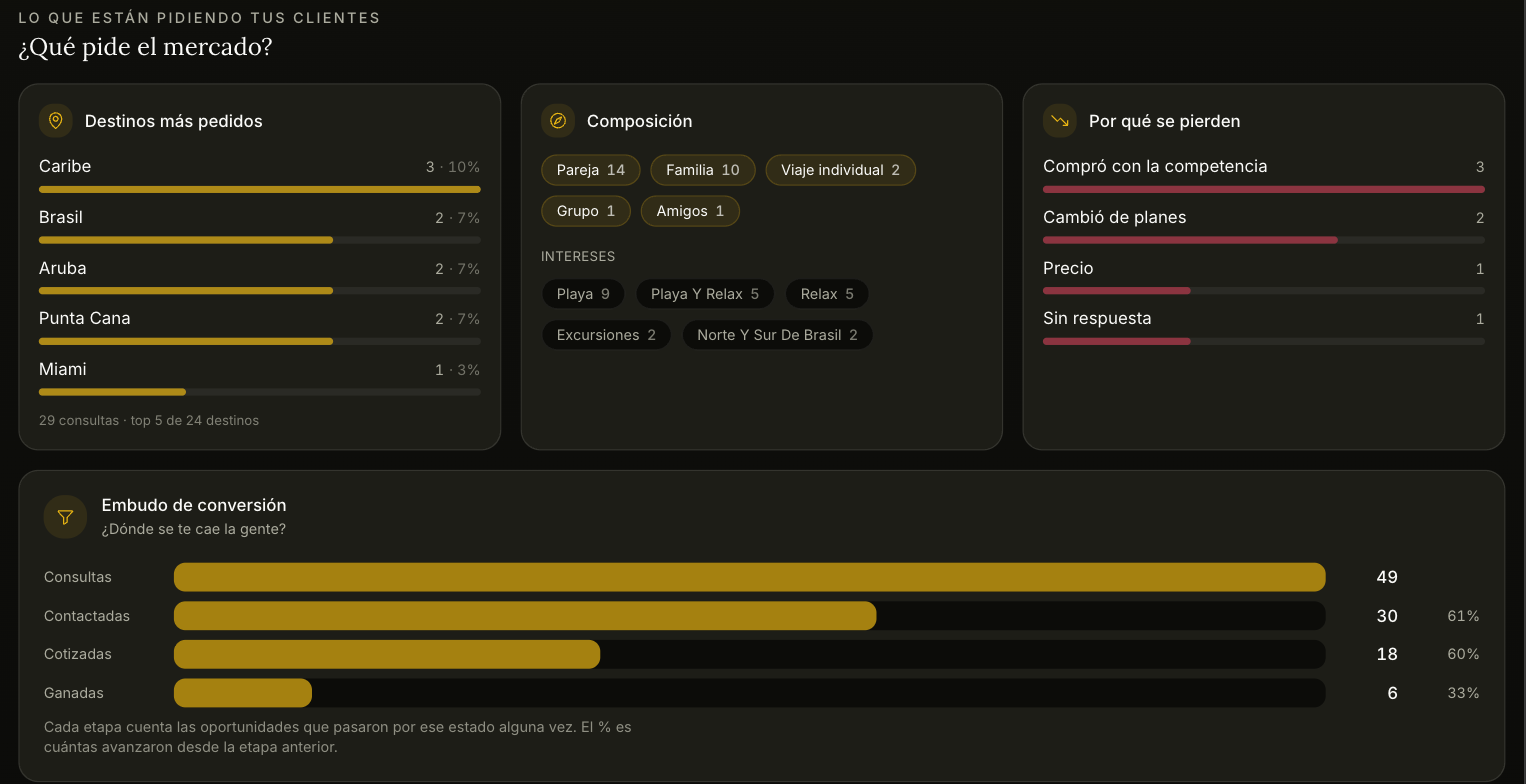
"Where they are today" and the conversion funnel are not the same chart, and mixing them up is easy. The first is a snapshot of the board right now, so it adds up to your current total. The funnel counts every opportunity that passed through each stage at some point, so its numbers are larger and its percentages are drop-off between stages.
Metrics is only visible to the Owner.